

Making 9 Million Jobless "Vanish": How The Government Manipulates Unemployment Statistics
By Daniel R. Amerman, CFA
Thanks to Mr. J, you are reading this!
Overview
When we look at broad measures of jobs and population, then the beginning of 2012 was one of the worst months in US history, with a total of 2.3 million people losing jobs or leaving the workforce in a single month. Yet, the official unemployment rate showed a decline from 8.5% to 8.3% in January - and was such cheering news that it set off a stock rally.
How can there be such a stark contrast between the cheerful surface and an underlying reality that is getting worse?
The true unemployment picture is hidden by essentially splitting jobless Americans up and putting them inside one of three different "boxes": the official unemployment box, the full unemployment box, and the most obscure box, the workforce participation rate box.
As we will explore herein, a detailed look at the government's own data base shows that about 9 million people without jobs have been removed from the labor force simply by the government defining them as not being in the labor force anymore. Indeed - effectively all of the decreases in unemployment rate percentages since 2009 have come not from new jobs, but through reducing the workforce participation rate so that millions of jobless people are removed from the labor force by definition.
When we pierce through this statistical smoke and mirrors and factor back in those 9 million jobless whom the government has defined out of existence, then the true unemployment rate is 19.9% and rising, and not 8.3% and falling.
For the small percentage of people who are aware that the purported decline in unemployment rates is primarily based on the mysterious rapid decline in "labor force participation rates" rather than the number of new jobs, the government has a ready and sensible-sounding explanation: the Boomers are beginning to retire in large numbers, and with an aging population, the percentage of adults who are in the workforce should logically be declining.
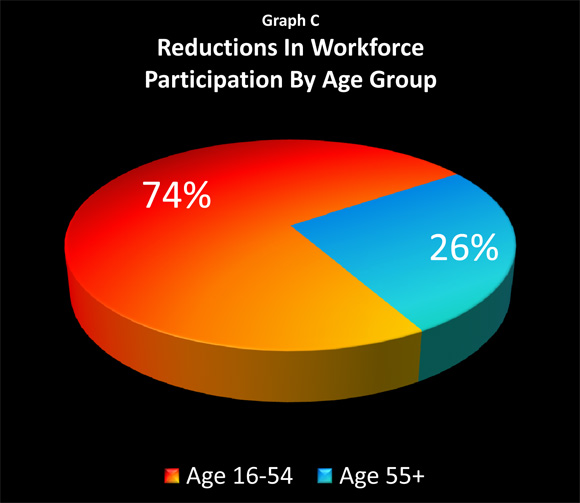
Based on in-depth analysis of the government's own numbers, we will present herein the true picture: 74% of the jobless who have been removed from unemployment calculations are in the 16-54 age bracket, with only 26% in the 55 and above bracket. Yes, the population is aging - but the heart of the workforce participation deception isn't about the old.
In an extraordinarily cynical act, the government is effectively saying that because the job situation has been so bad for many millions of unemployed people in their 40s, 30s, 20s and teens, they can no longer be considered to be potential participants in the work force at all. Because there is no hope for them - they no longer need to be counted. And it is this steady statistical cleansing from the workforce of the worst of the economic casualties - of these very real millions of individual tragedies - that is being presented as a rapidly improving jobs picture.
What the government's statistical deception is hiding is a catastrophic degree of change in generational employment levels, with the situation being much worse for the young and middle-aged than what is publicly presented. As the fundamental force of aging Boomers increasingly collides with the fundamental force of an employment disaster among younger Americans, the results may change everything that we think we know about economic growth, budget deficits, Social Security and Medicare, as well as all categories of investments.
Headline Unemployment (Box 1)
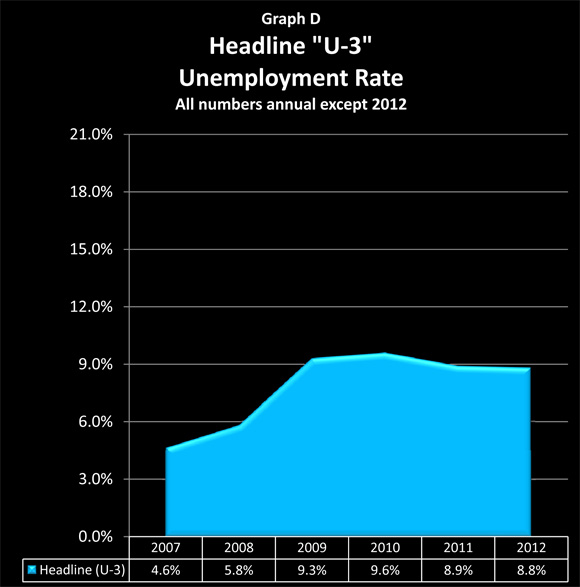
The graph above is our starting point and first "box". It shows the "headline" U-3 rate of unemployment in the US from 2007 through 2012 which is featured in newspaper articles and discussed on the cable business news. The rates shown are annual averages, except for 2012.
According to the Bureau of Labor Statistics, in January of 2012 the civilian labor force was 153.5 million people, of which 13.5 million were unemployed. Thus the actual unemployment rate was 8.8%, and seasonal adjustments dropped the reported unemployment rates to 8.3%.
(The raw numbers without seasonal adjustment were that unemployed people rose from 12.7 million in December to 13.5 million in January, for a net of 800,000 people losing their jobs in the real world, with the cheery and widely reported 0.2% single month decline in unemployment existing only inside the adjustments within the models.)
Full Unemployment (Box 2)
The U.S. Bureau of Labor Statistics calculates unemployment 6 different ways, U-1 to U-6, and it is only in the U-6 statistic that all the categories of unemployment are added together.
The two biggest differences between the U-3 official rate of unemployment and the U-6 full rate of unemployment are in the treatment of the long-term unemployed and involuntary part-time workers. For example, if you've been out of work for a long time and you badly want a job, but you know from your long search that nobody in your area is hiring; you already have applications on file at every reasonable prospect, and you haven't filled out a new application recently - then from an official (U-3) perspective, you are not only no longer unemployed, you just became a non-person altogether.
Alternatively, if you have a master's degree in engineering, lost your job, and are working 15 hours a week (the most you can get) in a convenience store at minimum wage to keep a little money coming in, then from an official (U-3) perspective you would be fully employed.
In contrast, U-6 is a more inclusive measure of unemployment, as it includes both the long-term unemployed and the involuntary part-time categories. Thus, individuals in each of the situations described above would be included in the U-6 measure.
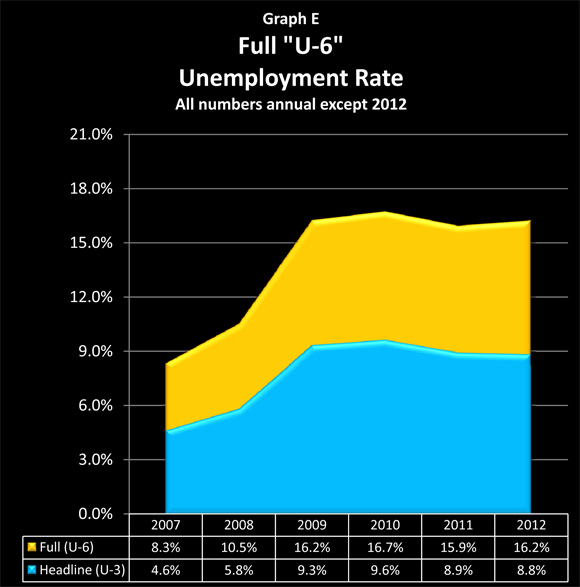
The yellow area in the graph above illustrates what happens when we look at the full, U-6 measure of unemployment. There are an additional 11.8 million people in the US who are considered unemployed under the broader U-6 measure, but not under the headline U-3 measure. When we include these long-term and discouraged unemployed, that means that there are 25.3 million unemployed, and our unemployment rate almost doubles, as we go from 8.8% to 16.2% of the civilian work force being unemployed.
In other words, the real unemployed go from the headline one-in-twelve workers, to one-in-six workers.
Understanding Workforce Participation & Unemployment
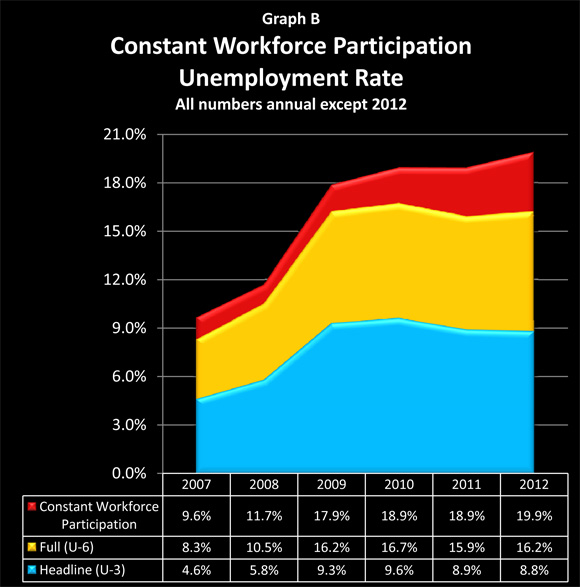
The term "Workforce Participation Rate" sounds so dull that it could put even an economist to sleep. And for most of our lives it has in fact been a remarkably boring statistic, changing only at an excruciatingly slow pace. However, in recent years and months, "labor force participation" has become a mystery worthy of CSI or Sherlock Holmes. Bizarre, inexplicable things are happening quite rapidly within this dry and deeply obscure measure. And, by fascinating coincidence, if these odd reductions in the workforce participation rate were not occurring, then the picture of the economy and employment that is being presented to us - changes radically. Consider the following chart:
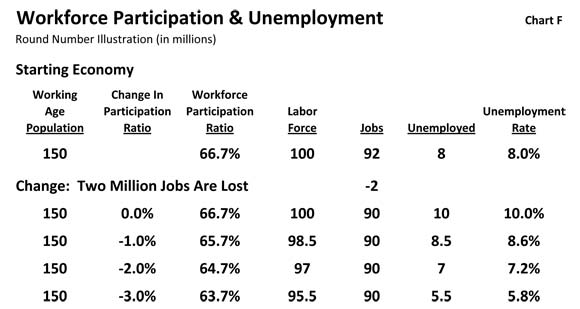
To understand how this obscure term not only relates to but actually determines the very hot topic of unemployment rates, let's take a quick look at a round number example of an economy, with 150 million adults, and say that of those adults, 100 million people want jobs. The other 50 million are not part of the labor force by either choice or circumstance: it could be they are stay-at-home moms, or in school full-time, or retired, or have physical or mental disabilities which prevent employment.
When we divide 100 million by 150 million, that is a workforce participation ratio of 66.7% (which is close to the US norm over the last 20 years). And when we calculate unemployment - we only look at the workforce, i.e. people who want jobs. If 92 million people have jobs, then our unemployment ratio is calculated by looking at the 8 million people who want jobs but don't have them, and dividing them into the labor force of 100 million people, which means that the unemployment rate is 8.0%. This is shown as the "Starting Economy" in the chart.
Now, let's assume that 2 million jobs are lost, meaning that now only 90 million people are employed. If there is no change in the workforce participation ratio, then it is pretty simple: 10 million jobless people out of 100 million people who want jobs, means the unemployment rate jumps up 2% to exactly match the 2 million jobs lost.
If the workforce participation ratio were to fall by 1%, however, then that would mean 1.5 million people would have left the workforce (keeping in mind the ratio is based on the total 150 million working age population, not the labor force). There are still only 90 million jobs, same as with our 10% unemployment rate above, but because "the workforce" has been reduced, we now subtract 90 million employed from 98.5 million in the workforce, and find there are only 8.5 million unemployed people. And when we divide those 8.5 million into our modified workforce of 98.5 million, unemployment has now risen to only 8.6%.
In other words, revising our workforce participation rate downwards by 1% made 1.5 million jobless people just plain disappear, and dropped the unemployment rate from 10.0% down to 8.6%.
That's pretty remarkable, but not nearly as remarkable as what happens if we drop the workforce participation ratio down by 2.0%. As can be seen in the next line in the table, that doesn't change the fact that 2 million fewer people have jobs. But because 3 million jobless people have now been removed from the unemployment calculations, we now have an almost miraculous situation: the unemployment rate doesn't rise at all, but falls to 7.2%, with only 7 million unemployed out of a labor force of 97 million people.
For a true miracle, however, we need to move the workforce participation ratio down by 3.0%. The removal from the labor force of 4.5 million jobless people completely overwhelms the technicality of there being 2 million fewer jobs, and sends the unemployment rate plunging to 5.8%. Break out the champagne, because as the official unemployment figures now prove: the economy is surging and happy days are here again!
The secret to our miracle is that we have two "hard" numbers and one "soft" number. The "hard" numbers are the total working age population and the number of actual jobs. The "soft" number is the definition of what percentage of the working age population wants a job. And a government which desires to control public perceptions can, by manipulating that obscure definition, make the reported unemployment rate "sit, roll over or bark like a dog" at will, almost regardless of what is actually happening with jobs.
Workforce Participation: Box 3
According to the government, among civilian Americans who were 16 years and older and not in prison or otherwise institutionalized, the number who were participating in the labor force fell by an astounding 0.4% in the first month of 2012 alone, which was a reduction of almost a million people. They didn't have jobs, they were counted the month before, but they can't be counted now, according to the government, because they aren't in the labor force anymore.
About 309,000 are already included in the change in our U-6 unemployment measure, but the other 654,000 just don't count anymore. Which between headline unemployment, full unemployment and people just disappearing from the labor market, brings us to the total of a full 2.3 million person reduction.
Box 1: Headline Unemployment (U-3) 777,000
Box 2: Full Unemployment (U-6) 848,000
Box 3: Additional Workforce Shrinkage 654,000
Total Job Losses & Workforce Shrinkage 2,279,000
To see the bigger picture - and a pattern that Sherlock Holmes might find quite easy to identify - let's take a look at population and employment from the years 1998 to 2012 in the chart below (all numbers are annual average except for 2012, which is January only).

The "Civilian Population" column includes everyone over 16 who isn't in the military and isn't institutionalized, and the "Fully Employed" column shows all employed persons, less those who involuntarily have part time employment.
Prior to 2001, workforce participation had been unchanged at an annual average of 67.1% for four straight years. Obscure, and about as exciting as watching paint dry.
Then there was a recession. To help see the correlation with the overall economy and purported employment situation, there is also a column showing the U-6 unemployment rate, which climbed for 3 years between 2001 and 2003. By interesting coincidence, the workforce participation rate suddenly started moving, and dropped by 1.1% in four years, as can be seen in the "Change In Participation Rate" column.
This may not sound like much - but as shown in the "Cumulative People Removed" column, this 1.1% drop happened to remove 2.5 million people without jobs from both the labor force and the unemployment numbers. Most were never put back, but became a permanent reduction in the unemployment rate, as a result of the government simply defining them out of existence.
From 2003 through 2008 we then go back to watching paint dry for six straight years, as the annual average labor force participation rate stayed within the narrow 0.2% band of 66.2% to 66.0%.
Then the biggest employment crisis since the 1930s hits in late 2008 - and by some mysterious coincidence, the labor force participation rate instantly becomes a fast moving statistic. It drops 0.6% in the year 2009 alone - and in the process, just happens to remove 1.4 million people without jobs from both the labor force and the unemployment numbers. There are drops of 0.7% and 0.6% in 2010 and 2011, making another 3.1 million people without jobs entirely disappear from view.
2012 workforce participation started with a sizzling 0.4% decline, removing a million people without jobs from the labor force statistics in one month - as the band played on, and the cheerful labor statistics helped the stock market indexes climb.
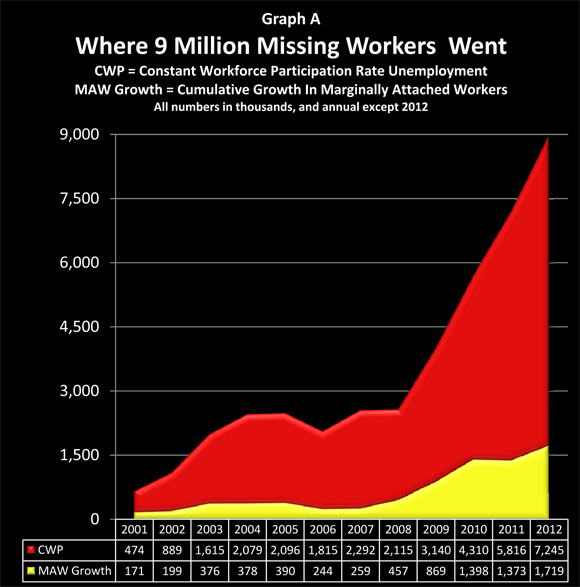
The last column, "Constant Workforce Participation" (CWP) unemployment rate shows what unemployment statistics would have been in each year if the government did not keep permanently removing millions of jobless people from the unemployment rate calculations. This is a modified U-6 full unemployment calculation, that includes the officially unemployed, involuntary part-time workers, and the 9 million people without jobs who have been cumulatively defined out of the workforce.
When we include all of the first three boxes of unemployment, then the purported improving employment situation for the beginning of 2012 disappears altogether, and is replaced by a sobering statistic: in January of 2012 the unemployment rate reached 19.9% for the first time in this crisis. The situation is not improving - indeed, it is getting worse again.
To see exactly how the CWP numbers are calculated, click here to read "The Calculation Of Constant Workforce Participation Unemployment". This more technical article provides the methodology and equations, as well as significantly more information on the different classifications of the jobless over time, including the numbers behind the dramatic slope of Graph A in the introduction.
Changing Trend Lines & Narratives
At first glance, the red CWP addition to the graph may have seemed relatively minor compared to the larger U-3 and U-6 unemployment problem, as it is the smallest of the three "boxes". However, when we include Constant Workforce Participation, we change both the narrative and the longer-term trend line. Indeed, we don't just change them, we entirely transform them.
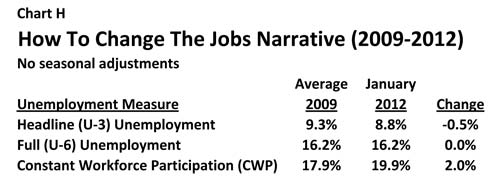
As we can see above, there is a compelling and accepted narrative that the unemployment rate is falling, and we can read about it in every newspaper. Just look at the numbers, and even without seasonal adjustments, the rate is down by half a percent since 2009.
Include both U-6 and CWP unemployment, however, and real unemployment is up by 2.0%. What the rapid removal of millions of people from the unemployed rolls has accomplished, is to allow an entirely different narrative to be used when discussing what is happening.
Unfortunately, there is an even more serious implication as well, and that has to do with the trend lines.
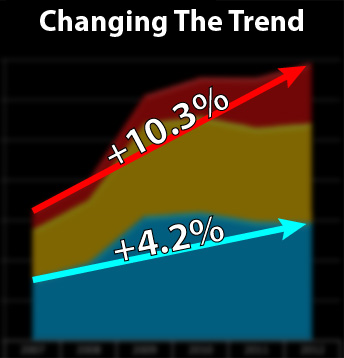
The blue arrow is the Headline U-3 trend from 2007 to January of 2012, and it shows a 4.2% rise in the unemployment rate. When we hold workforce participation constant since 2007, the labor force becomes about 160 million people, and a 4.2% unemployment increase means 6.7 million additional unemployed people.
The red arrow is the CWP trend line, and it has a much steeper slope - about 2.5X as steep as the U-3 slope. Since 2007, the Constant Workforce Participation unemployment rate has risen from 9.6% to 19.9%. This increase of 10.3% for a labor pool of 160 million people means 16.5 million additional jobless people since 2007.
The difference between 6.7 million missing jobs with a rapidly improving jobs picture, and 16.5 million missing jobs with unemployment still rising, is the difference between night and day. It is the difference between a recession being brought under control - and a depression that continues to worsen.
It is also the difference between perception management - and the truth.
The Young, The Old & Workforce Participation
For the comparatively few who follow workforce participation rates, the government does have an easy explanation. It's all those Boomers in their vast hordes, getting old on us. Older people retire, so the higher the proportion of old people in a nation, then the lower the workforce participation rate should be, right? This is an intuitively appealing explanation - and in truth, over each one of the next 15 years this fundamental force of a declining number of workers per retiree will indeed come to dominate the economy to an increasing degree, with likely devastating implications for not just Social Security but the stock market as well.
However, this growing pressure is still in the early stages, and is nowhere near the dominant influence it will become within the next five to ten years. The real explanation for what has been happening over the last five years doesn't revolve around the old, but the young.
Consider the chart below, which breaks the civilian population out into age groups, and looks at jobs and workforce participation (all raw data is from the Bureau of Labor Statistics, as is everything else in this analysis unless otherwise specified). The starting period is 2007, the last year before the bottom started dropping out, and the ending period is January of 2012.
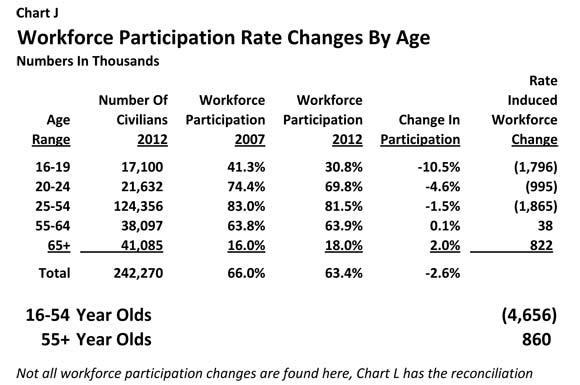
If it were an aging population that was driving the percentage changes in labor force participation rates, then we would expect to see nothing happening with people below age 50, and the declining rates would be with people in their 50s, 60s and over. But that isn't what is happening at all.
On a percentage basis, the largest number of people "defined out of the workforce" by the government were 16-19 year olds. In 2007, 41.3% of teens were counted for employment and unemployment purposes, but by January of 2012, it turned out that only 30.8% were in the labor force, a sharp reduction of 10.5%. So 1.8 million teens were dropped from the labor force by definition, so they no longer existed for unemployment statistics purposes, and what every one of those teens had in common was that they didn't have jobs.
The next biggest percentage change was among 20-24 year olds, who had an abrupt decline of 4.6% in their workforce participation. For some reason known only to the government, one million 20-24 years olds just lost all interest in work, and could be removed from the unemployment calculations.
In the largest age bracket, those 25-54 year olds in their prime working years, there was another mysterious participation rate decline of 1.5%. While much smaller than the percentage declines with the younger workers, for the simple reason that there are so many 25-54 year olds (124 million), the greatest number of jobless people went missing - 1.9 million - from the unemployment calculations in what is usually the very heart of the labor force.
The 55+ age group actually saw minor increases in their workforce participation rates, with 55-64 year olds experiencing a 0.1% rise, and those 65 and up seeing a full 2.0% rise. This change in behavior can be relatively easily explained by what has happened to retirement account values, as well as the currently very low level of interest rates, which slashes retirement income levels for many potential retirees who have followed the conventional retirement planning advice.
A generation that can't afford to retire, doesn't retire, and the government statistics reflect this with a very small increase in workforce participation rates among those 55 and older. Frankly, given the state of retirement accounts and retirement income, it is curious and even remarkable that the increase in workforce participation is reported to have been so low in these age categories. If, say, 10% more of the people turning 65 were actually wanting to stay in the work force in 2012 when compared to 2007, but couldn't find jobs, then the size of the labor force - and therefore unemployment rates - would be significantly higher.
(Interestingly, 55+ is the very best place to "game" the workforce participation rates, precisely because it is the hardest to get "caught" there, and there are statistical reasons to believe that is exactly what is happening. If true, then the degree of participation rate manipulation, and the millions of jobless people inappropriately removed from unemployment calculations, could be much larger than what is shown herein. However, to keep this article from becoming book-length, that needs to be another topic for another day.)
Real Unemployment Rates Among The Young & Middle-Aged
When we earlier looked at round number illustrations of a hypothetical government creating false unemployment statistics through manipulating participation rates, the examples of 2.0% and 3.0% manipulations turning 10.0% real unemployment into 7.2% and 5.8% reported unemployment, might have seemed a bit "over the top".
In this instance, however, all we need is the federal government's own very dry and obscure tables of data, and an understanding of what it means, which this article seeks to provide. When we use this data - we see a degree of blatant manipulation in the real world, that actually puts our round number illustration to shame.
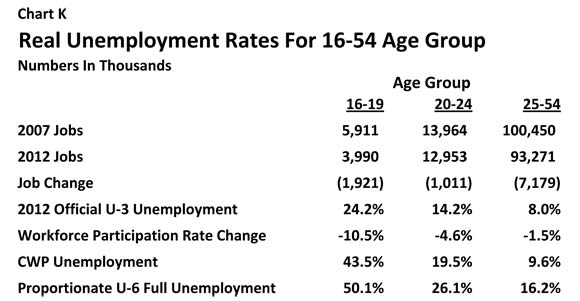
There were about six million employed teens in 2007, and by 2012 this number had plunged to four million, meaning that one in three teen jobs have disappeared. Yet, the official youth unemployment rate is stated to be only 24.2%. This deception was accomplished by simply dropping a 1.8 million teens (10.5%) from the labor force, thereby hiding what would have been a 43.5% unemployment rate with a constant teen workforce participation rate . (There are 17.1 million 16-19 year olds (rounded), and with 2007's participation rate, 7.1 million of them would be in the labor force, and with 4 million actual jobs, that means 3.1 million unemployed, which works out to our 43.5% unemployment rate).
Overall levels are even higher when we take into account that this is just the headline U-3 unemployment rate. The government does not breakout the U-6 data for all age groups, however we can do an even adjustment of all age groups for both involuntary part time workers, and "normal" discouraged workers, which works out 6.6% for the nation. Adding that average adjustment to the teen data produces a 50.1% unemployment rate.
When we look at 20-24 year olds, then the reported unemployment rate of 14.2% was actually created by the government dropping the labor force participation rate by 4.5%, which concealed what would otherwise be a headline (U-3) unemployment rate of 19.5%. When we hold participation constant, and adjust for the full (U-6) number of jobless - thereby including all three "boxes" - the true unemployment rate for 20-24 year olds becomes 26.1%.
(As covered in my article, "Hiding A Depression: How The Government Does It", there is actually a 4th box as well, which is the "artificially employed": those whose jobs depend on the government spending money which it doesn't have and can't realistically repay. When we add the number of jobs dependent on maintaining an impossible level of government spending, then the total unemployment rate for the nation rises to near 30% for the nation as a whole, and about 35% for 20-24 year olds.)
It is reasonably well known that there is a serious unemployment crisis among the young in America. What is not understood is that the situation is worse than what is shown in the official statistics. Indeed, the government is taking extreme (statistical) measures to make sure that the public remains uninformed about the full extent of the youth unemployment crisis.
The problem also extends to the center of America's workforce, those aged 25-54. There were 7.2 million fewer employed people in their prime working years in 2012 than there were in 2007, and there is just no getting around the 7.2 million people adversely affected. There was a manipulation here as well: for no logical reason, the workforce participation rate was dropped by 1.5%, which reduced the headline unemployment rate from a real 9.6% to a reported 8.0%. Adjust for full U-6 unemployment, and with all three boxes our total is a 16.2% unemployment rate for those in their prime working years.
(As an aside for mathematically oriented readers: some of the variations in the impact of participation rate changes may intuitively seem a bit "off", but that is because the degree to which a given participation rate change affects an age group is dependent on the starting labor force participation ratio for that particular group.)
An Aging Population & Shifting Age Buckets
One way of thinking about workforces and participation rates is as a series of buckets based on age. As a year-class (say those who graduated from high school in 1970) ages, they pass through this series of buckets, and their participation in the labor force changes depending on which age bucket they are in at the time.
Historically and with a normal economy, the participation rate sharply rises between ages 16-24 as people steadily move from the schools to the workforce, and the full adult participation rate of around 83% is reached by about the mid 20s. This peak rate stays in a fairly narrow range for about 30 years, and then as people reach the latter half of their 50s, a significant decline in participation begins that accelerates through the 60s until only 10% of the population is still in the workforce at age 75 and beyond.
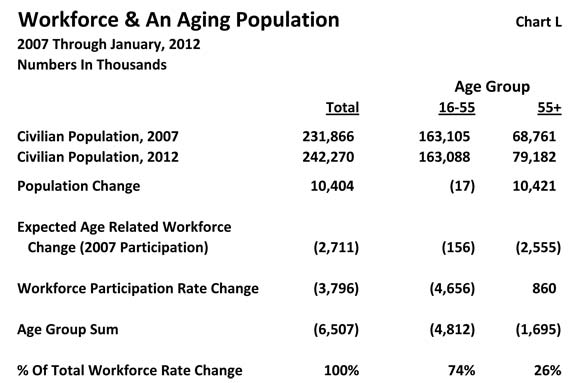
As shown in the table above, between 2007 and January of 2012, the number of people over the age of 55 grew by 10.4 million, and the number of people aged 16-54 shrank by 17,000. Because we now have 10.4 million people who have moved along to older age "buckets" where we normally have falling participation in the workforce - the average participation rate should be falling, all else being equal (the adverse developments with retirement investment accounts and interest income, however, mean that not all else is equal).
To find out how much changing ages should have changed participation, we pour into each age "bucket" the appropriate number of people for early 2012, and find out what would have happened if the government had held the participation rate for each bucket constant at 2007 levels.
When we do this, we get what is shown in the line "Expected Age Related Workforce Change". When we compare 2007 to 2012, then in a normal economy we would have expected a reduction in workforce participation of about 2.7 million people, with the aging Boomers and their parents removing about 2.5 million people from the workforce, and the changing age composition of the younger than 55 population should have removed another 150 thousand people (the prime 25-54 age group actually shrank by 1.3 million, and were replaced by less likely to be employed 16-24 year olds).
However, the government didn't remove 2.7 million people from the workforce - it removed 6.5 million people. Everyone else was removed via the method previously described, that of changing the workforce participation rates for each age "bucket", primarily among those 54 and younger. The "Workforce Participation Rate Change" line is from Chart J above, and it is found by multiplying the participation rate definition change by the number of people in each bucket.
When we add both categories together, that of people moving into different age buckets, and that of changing government definitions for what percentage of each age bucket is in the workforce, then we get our 6.5 million total change.
Of the total, only 1.7 million, or 26%, were aged 55 and older (net of the 860 thousand jobs added by slightly increased workforce participation). Conversely, 74% of the removal of the jobless occurred among those aged 16-54, as the government has blatantly and rapidly changed labor force definitions for the young in a manner that has twisted a rising 20.0% unemployment rate into a publicly reported falling 8.8% unemployment rate.
The truth about unemployment is not what the press releases say it is, and it is the U.S. government's own numbers that prove this in damning detail.
It is worth noting again that perhaps the most questionable aspect of the government's numbers is what is happening to those above age 55 when it comes to retirement choices, retirement account values and retirement income. In an environment where retirement account values are falling woefully short of financial planning projections from years ago, and interest rates are not much above zero percent, is it really true that only a mere 0.1% of potential retirees who are in the key discretionary retirement age range of 55-64 have changed their behavior between 2007 and 2012?
Based on who you know, do you believe that among 55-64 year olds, the number choosing to delay retirement and stay in the workforce has climbed only from 63.8% to 63.9%?
If more than one in a thousand potential retirees aged 55-64 is changing their individual behavior because of what has happened with the economy and investments, and they are attempting to defer retirement but they don't have a job, then the true total of jobless being hidden since 2007 could be significantly higher than 6.5 million, and the real unemployment rate could be higher than 20%.
The Bigger Picture
The heart of the long-term problem with employment in America can be seen in Chart G above, when we compare the population for 2000 and 2012, and those fully employed in each year. The "working age" civilian population rose almost 30 million - from 212.6 million to 242.3 million - while the number of fully employed people fell 1 million, from 133.7 million to 132.7 million.
Our long term labor force participation rate is about 66%-67%, or two-thirds. So to maintain constant employment rates, if there are 30 million more people over 16, there need to be 20 million more people in the labor force, and roughly 19 million more jobs (allowing for normal unemployment). Instead, when we look at the fully employed (employed workers less involuntary part-time workers), there are one million fewer jobs now than in the year 2000.
Thirty million more people over the age of 16 and one million fewer people being fully employed is a shortfall of 20 million jobs, and this by itself creates Great Depression range unemployment levels. Fundamentally, this is not even remotely consistent with a reported unemployment rate in the 8% range.
The government is attempting "information management" (aka manipulating statistics in a manner specifically intended to deceive) when it comes to how the public perceives this situation. The method used is to split the catastrophe into three boxes: putting 13.5 million jobless people into the first box of official unemployment for press release purposes; segmenting another 11.8 million jobless into the second box that is hidden in the U-6 footnotes, and making another 7.2 million jobless disappear completely by using the third box of changing the workforce participation rates (outside of U-6 since 2000).
Those three boxes add up to 32.5 million jobless, and the 12.5 million jobless over and above the 20 million missing jobs is in the ballpark for what would be "normal" (5.2%) full unemployment for a population of 242 million people aged 16 and above.
Everything adds up, and the big picture of those 20 million missing jobs reconciles with current improving official unemployment statistics when we dive deep into the heart of the workforce participation deception, and discover that the worst of the damage is among those younger than 55. That is the opposite of the cover story for the decline in labor force participation rates to date. But intuitively, this is a good fit with the big picture of 30 million more people in the working age civilian population, and 1 million fewer jobs.
We might expect that those who have good jobs would (mostly) pull those jobs forward in time along with them, but that those who enter the labor force behind their employed elders find that the door is shut, at least when it comes to the most desirable jobs. And it gets a little worse every year, as teens enter their 20s, go through their 20s, and then enter their early 30s, without ever landing the kind of solid and reliable middle class job that can support a family in a house (or pay enough in taxes to support a retiree and pay for their health care).
And when we pierce through the statistical manipulations - that is exactly what is happening. Employment has been devastated among the young. Which is precisely why there has been such a blatant manipulation of workforce participation statistics among the young in particular. With nothing in those statistical manipulations changing the bigger picture of twenty million missing jobs, and a total that continues to grow annually.
Deceptions & The Problem With The Future
One of the big problems with deceptions is that they can have ripple effects.
These ripple effects can cause particular problems when it comes to our expectations about the future. If what we believe about the past and the present are both wrong - then when we project forward that false information, we get a result that is likely to be disastrously wrong.
This statistical problem is sometimes referred to as GIGO: Garbage In, Garbage Out. Unfortunately, we have a major GIGO problem when it comes to the future economy, tax revenues, deficits, Social Security, Medicare - and investment performance.
When we project forward the train wreck that has been happening with employment and workers younger than 55 - then everything that we think we know about Social Security, Medicare, and federal budget deficits shatters into little pieces. The unending trillion-dollar-plus federal budget deficits that we see discussed in newspapers - are themselves based upon ignoring what has actually been happening with employment since 2000, and instead projecting forward the healthy growth of a healthy economy, that in truth hasn't been healthy for a long time. Without that growth - taxes are much less than projected, deficits get much larger, and the crises with Social Security and Medicare get much worse, much faster.
The heart of the problem is that there are two different kinds of reductions in workforce participation rates - and they are on collision courses. One kind is the subject of this article, which is the statistical deception that is being committed to cover up the full extent of the still growing unemployment crisis among those aged 55 and younger.
The second kind of falling workforce participation is the fundamentals of demographics and what will become a dominant reality for the economy. The Boomers are aging, and by 2027, population projections are that there will only be two people in the 16-64 labor force for each person aged 65 or over. Leaving aside children, and going a level deeper than the facade of money-based projections, the true fundamental factor that governs everything is the ratio of two people producing resources for each one hopeful retiree consuming resources. (Over the long-term and for societies as a whole, money is only an easily manipulated symbol; goods and services are the reality that determine actual standards of living.)
Even with a robustly healthy economy and full employment - let me suggest that it has always been a very dicey proposition in terms of those two workers paying for their own family, the military and government infrastructure and other transfer payments, and then supporting one older person between them, while buying out massive sums of Boomer retirement account and pension investments at the highest prices in history with the money they have left over every year.
Indeed, in my opinion this has never been possible, and as I have been writing about for many years now, much of conventional retirement planning is based on a fairy tale which assumes fifty million Boomer investors can compound paper wealth together at a rate much faster than the growth in the real economy - and then somehow simultaneously cash this paper wealth out into real resources that don't exist.
But when we have a real economy that isn't experiencing healthy growth but is instead staggering, with imploding employment levels among younger workers - then there are two major implications which turn a building disaster among the young into a future disaster for the old. The first implication is that the gap between what has been promised and what is available must grow. The less real wealth that is produced by the actively working young, then the less wealth there is available for the old after retirement, whether we are talking about public transfers or private investments.
Politicians and financial firms can make all the soothing projections they want, but the fundamentals are that fewer jobs for the young mean greater eventual impoverishment for the old, and there is no getting around that.
The second implication is that the demographic financial crisis is brought forward in time. An average of four million Boomers will be reaching traditional retirement age each year. Meanwhile the job base among the young has been shrinking. The longer those two forces are occurring simultaneously, the faster the gap between expectations and reality grows, and the sooner the arrival of a crisis which could dwarf what we have seen to date.
This situation is a powerful incentive for older Americans to ramp up their savings and investment rate. Ironically however, the worst of the damage from employment statistics GIGO is not in the public sector, but can be found in the deception of private investors. Most of the value of the stock market is based upon expectations of future growth, which are being enabled by garbage statistics about what has actually been happening in the past and present. Remove the growth - and most of the current value of the markets goes with it, for when jobs implode, so do stock markets.
This can be seen very clearly by what happened to stocks the last time we had a major (albeit lesser) jobs crisis in this country. As covered in my article, "Deadly Dow 36,000 & The Secret History Of A 70% Market Loss" (link here), there are ample historical reasons to believe that the jobs crisis may create a stock market illusion, with apparent rising stock market indexes that mask investment values plunging in inflation-adjusted terms.
This is a national emergency, and what is needed more than anything else is full honesty about what is happening, and a nation pulling together to change what can be changed.


This website contains the ideas and opinions of the author. It is a conceptual exploration of financial and general economic principles. As with any financial discussion of the future, there cannot be any absolute certainty. What this article does not contain is specific investment, legal, tax or any other form of professional advice. If specific advice is needed, it should be sought from an appropriate professional. Any liability, responsibility or warranty for the results of the application of principles contained in the article, website, readings, videos, DVDs, books and related materials, either directly or indirectly, are expressly disclaimed by the author.
Copyright 2
No comments:
Post a Comment